OilX performs your analytics to the highest standard, saving you time and increasing your productivity

Request a demo →

OilX selected as OPEC secondary source

Find out more

OilX and OPEC

The OilX Platform combines conventional oil statistics with real-time data from satellites and maritime intelligence to deliver the most precise measurement of the global oil market.

A complete view of the global oil supply chain

A trader’s edge is no longer boots on the ground but eyes in the sky.


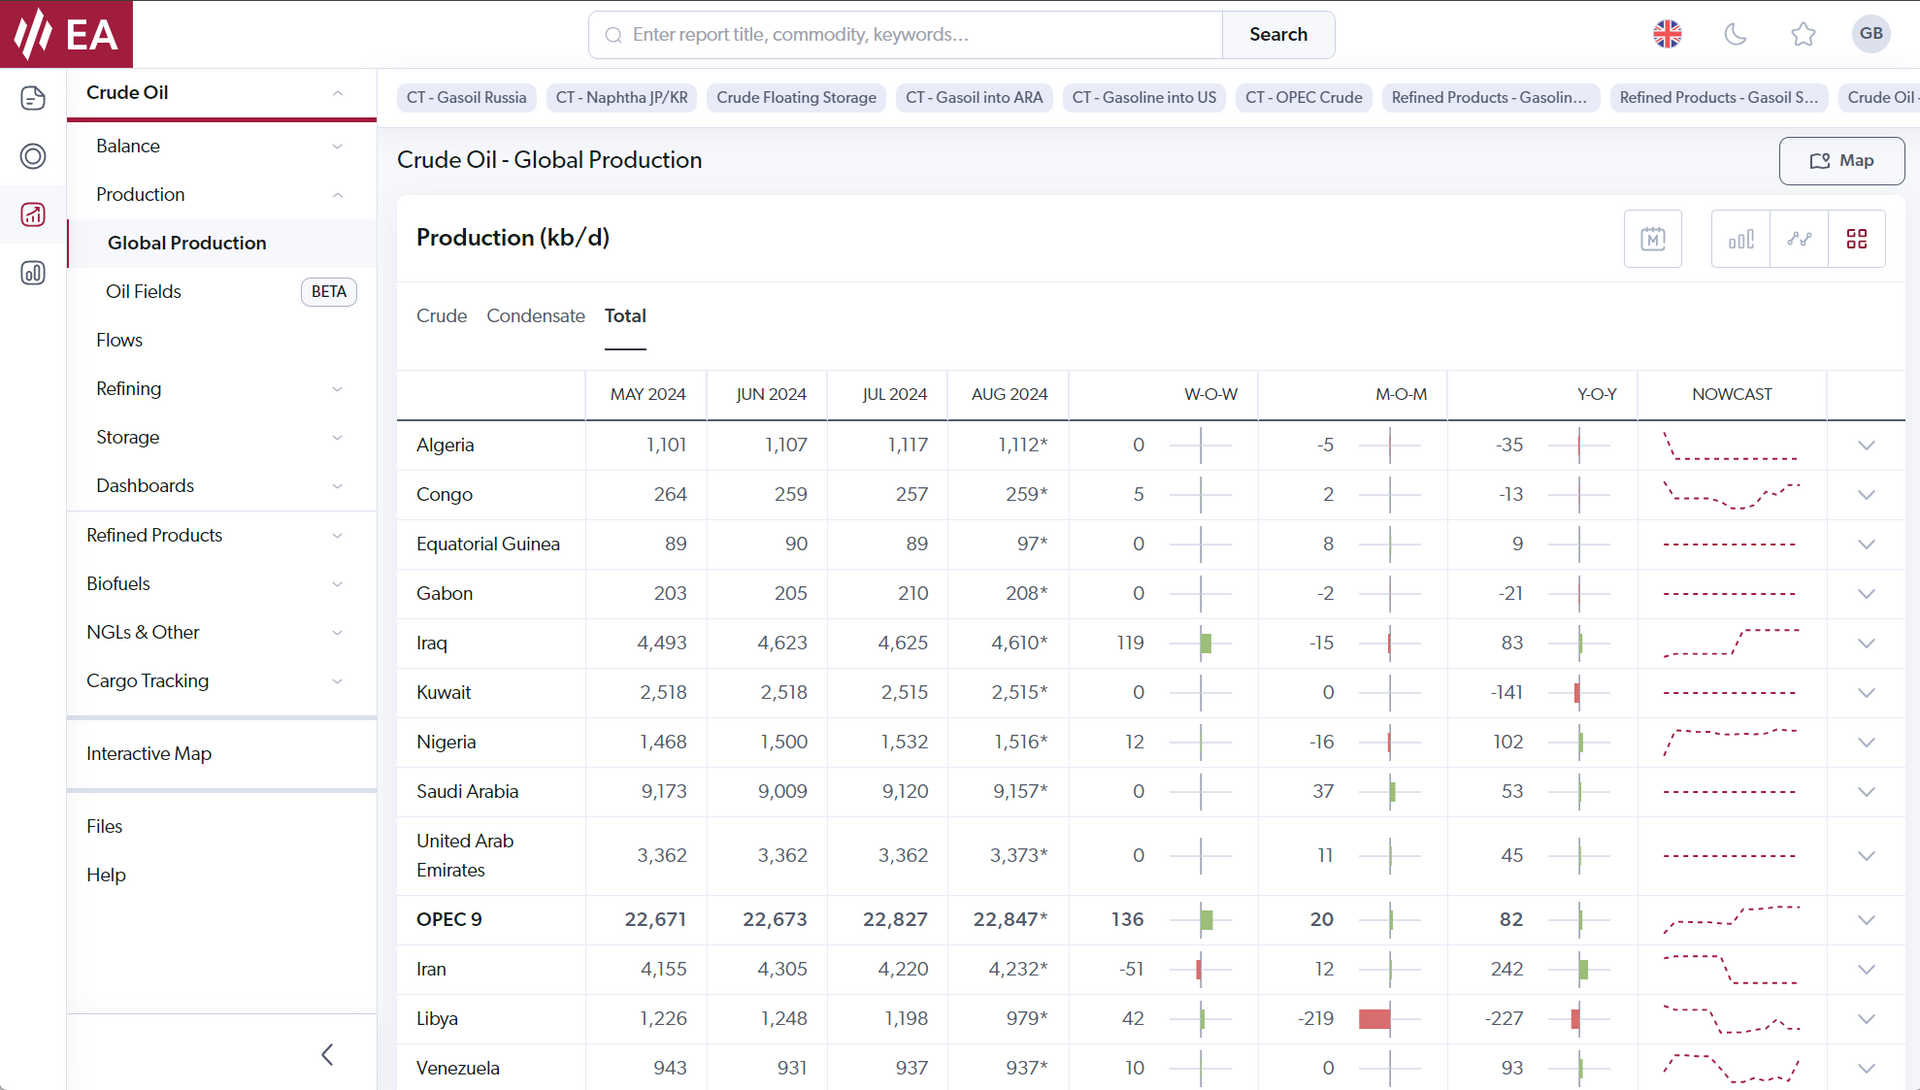
We track every barrel of oil, throughout the value chain. Earth observation satellite data provide clarity on upstream output and oil storage, while real time maritime information add transparency on global trade flows, forming comprehensive import export volumes. 
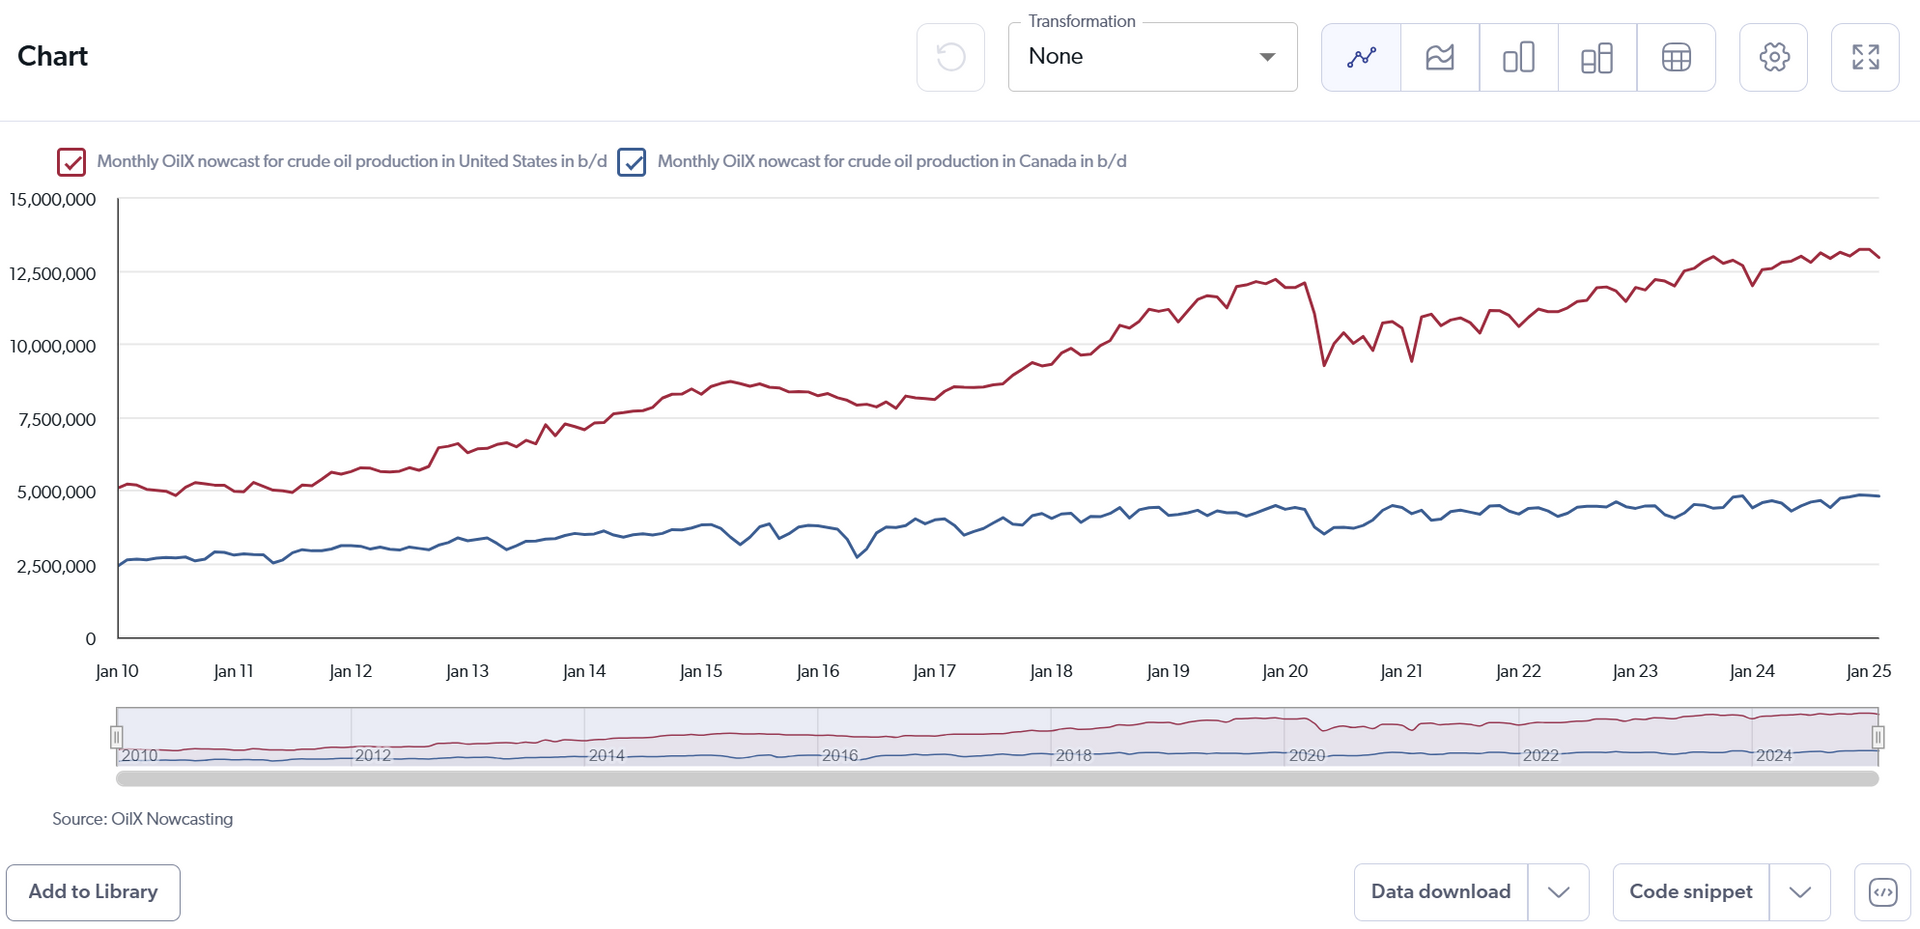
Nowcasting

Satellite Earth Observation

Machine learning

Augmented oil intelligence

The problems we solve

Real-time data

Oil trading markets operate in real-time but current data is lagging by up to 3 months.

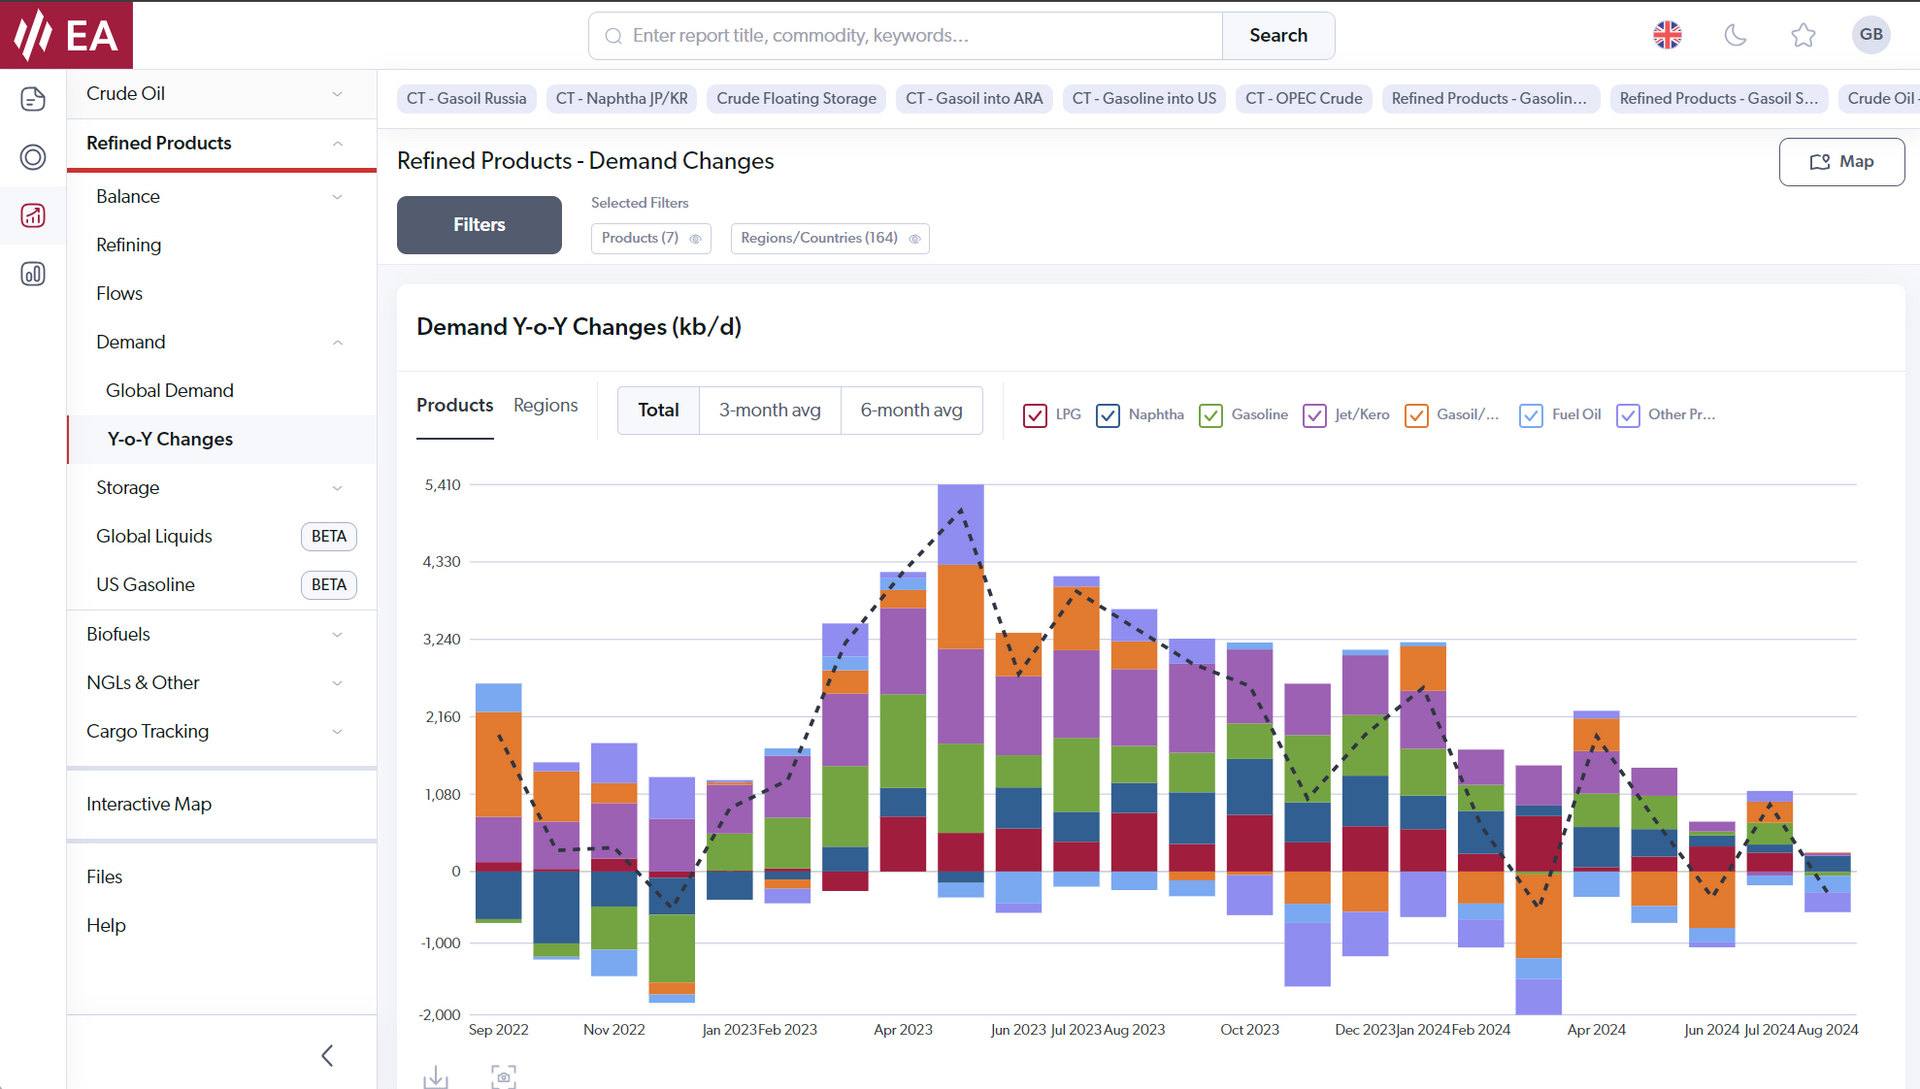
Advanced oil analytics

Deep sector expertise and advanced analytical capabilities are required to meaningfully process oil market data.

Trading efficiency

Current analysis methods are time consuming, prone to human error and don’t operate 24/7.

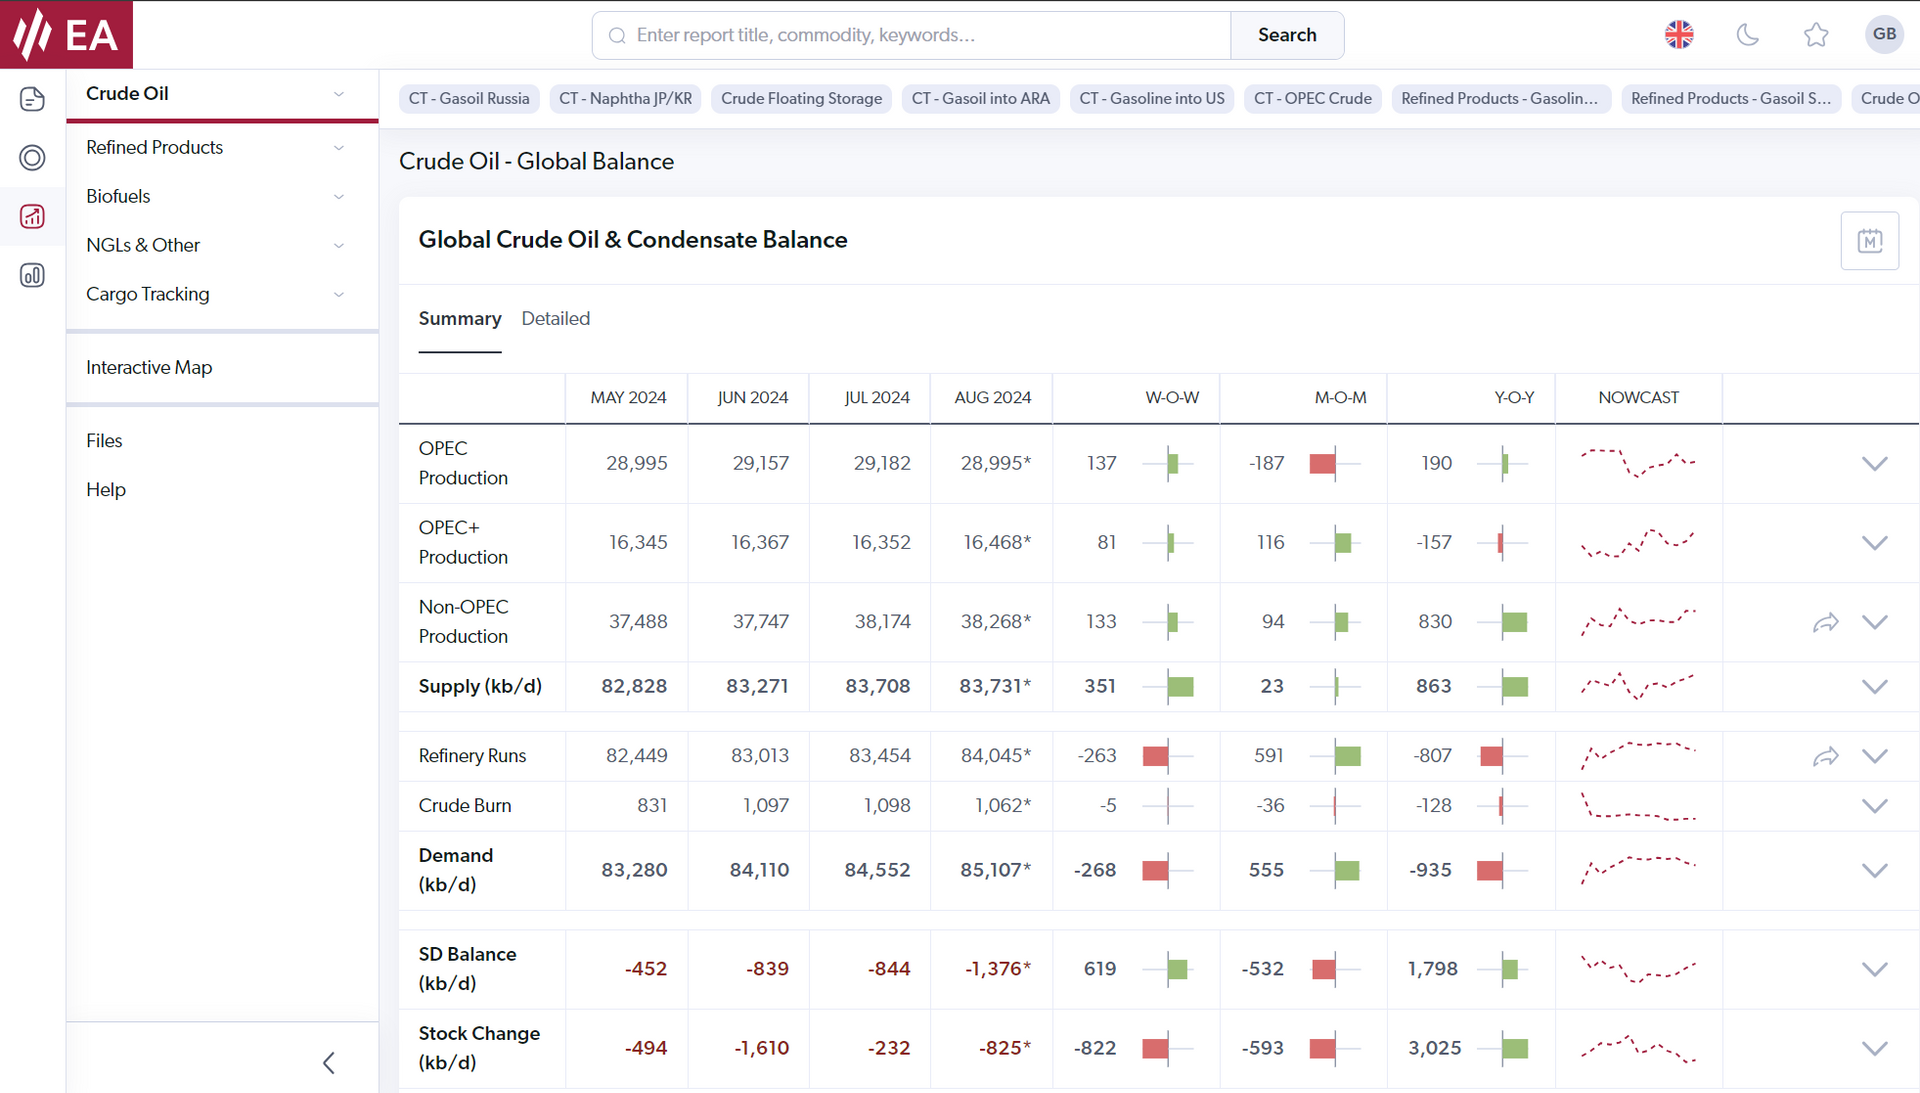
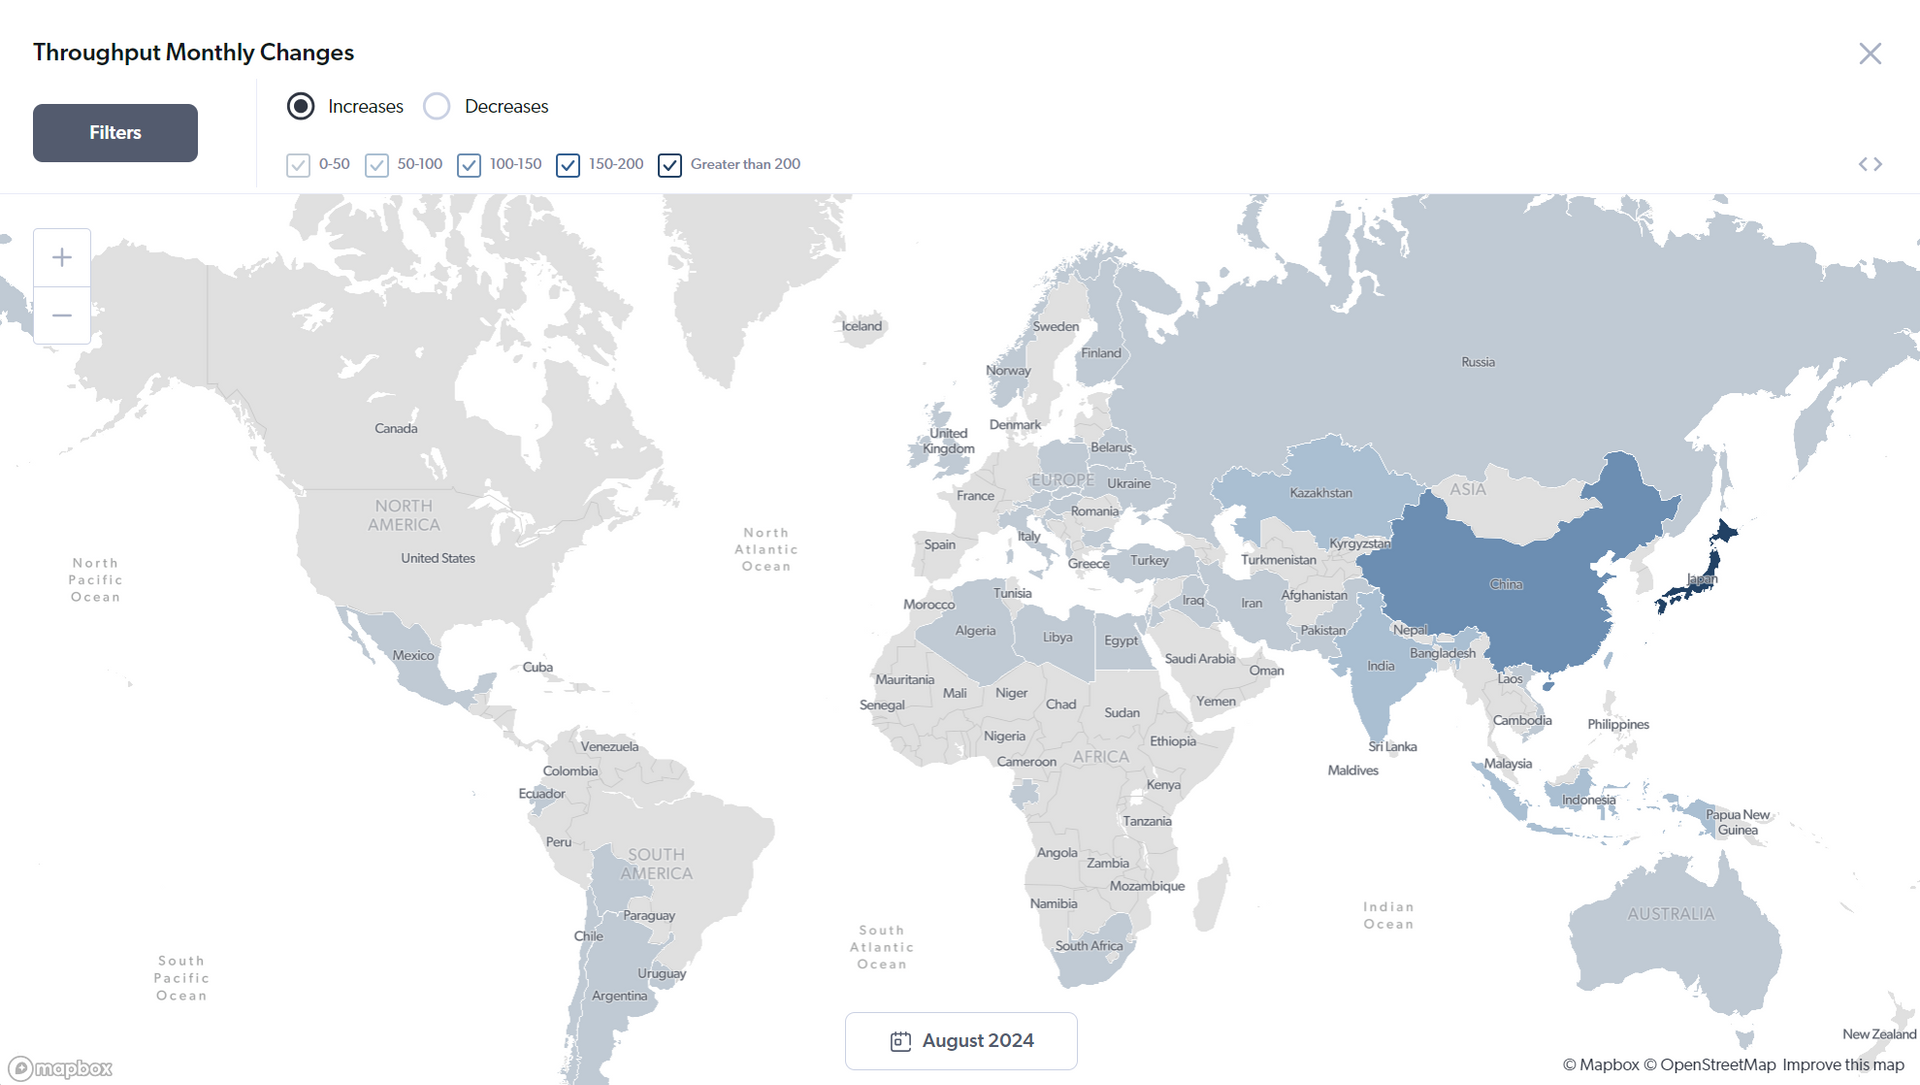
Powerful dynamic maps and tracking

Drill down into detailed cargo and voyage information for crude, clean and dirty products.

How this benefits you

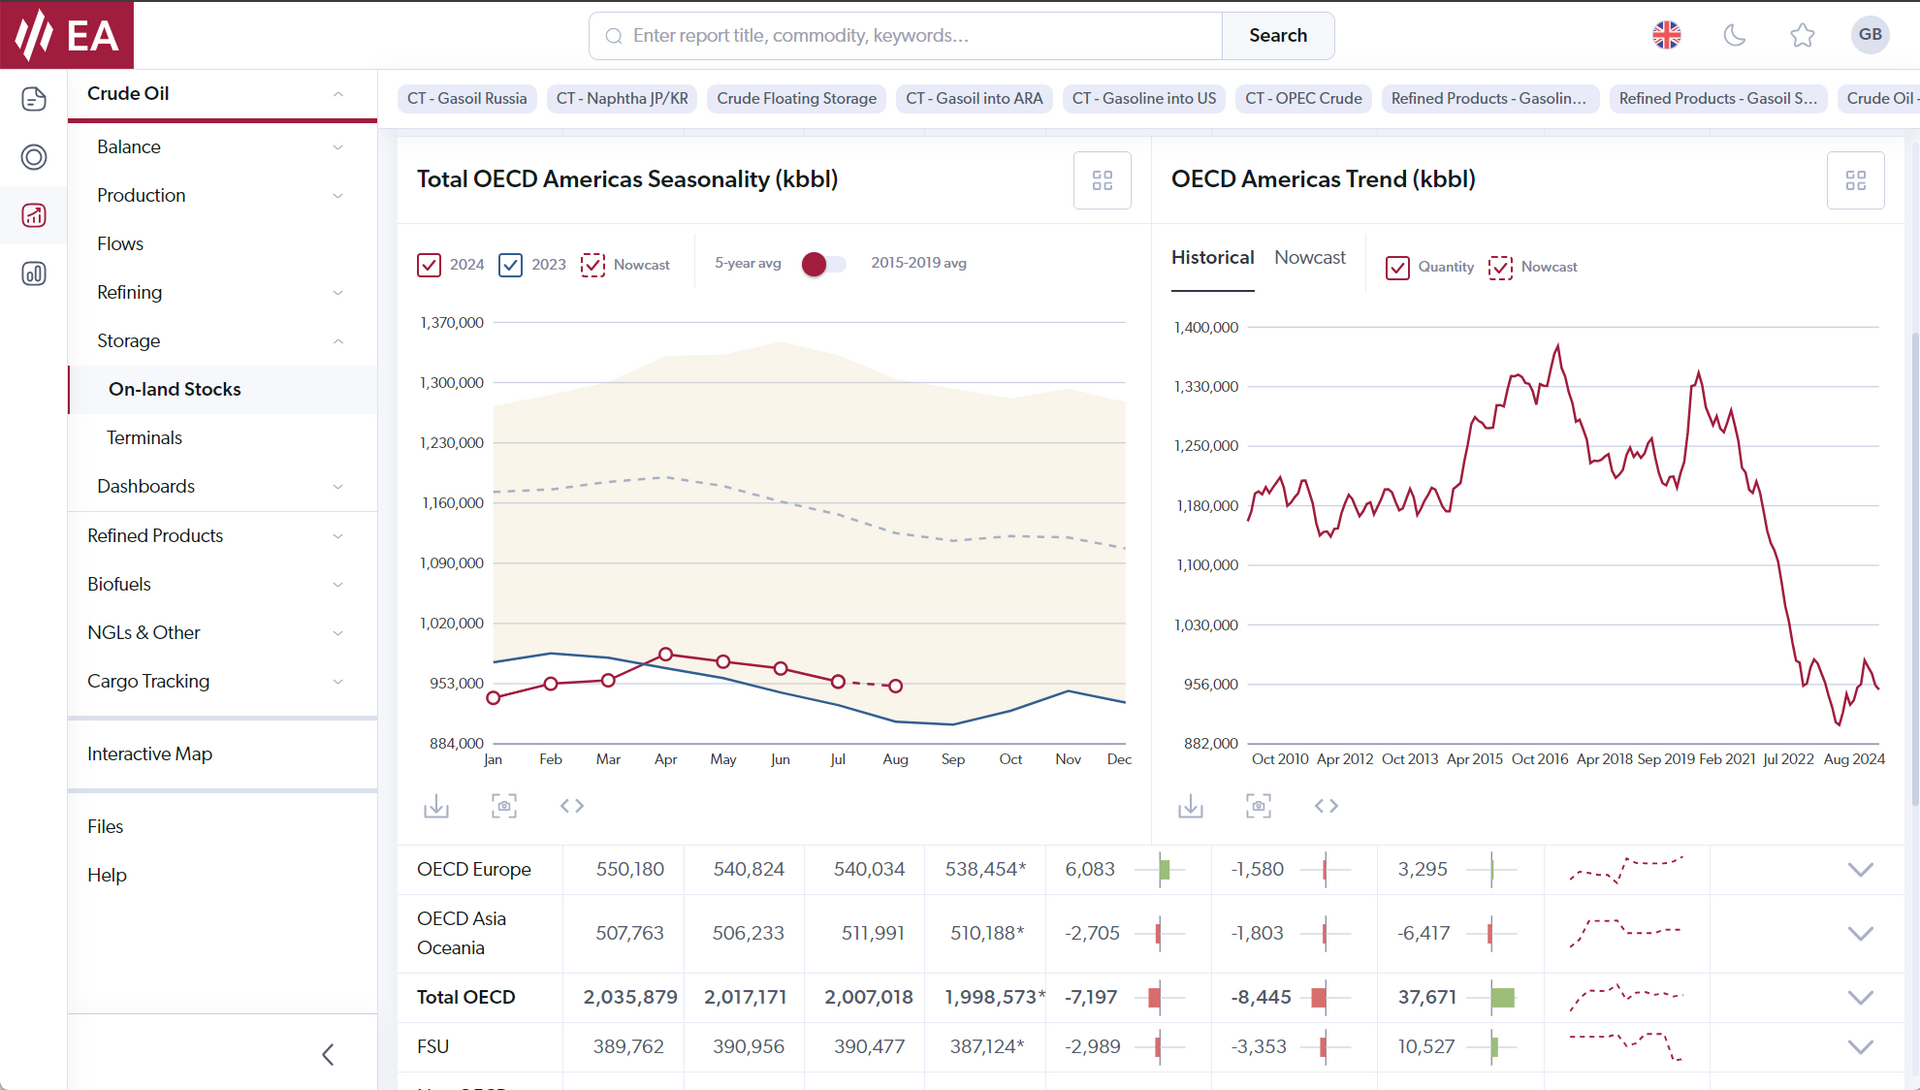
Our OilX Platform delivers a comprehensive real-time view of global oil supply-demand balances for over 160 countries using cutting-edge nowcast technology.

Global Oil Balance 

Gain a comprehensive real-time view of global oil supply-demand balances for over 160 countries using cutting-edge nowcast technology.


See the evolution of all supply-demand balance parts using our cutting-edge nowcast technology, that’s already back tested.


Pre-built dashboards, charts and tables to meet the needs of the most demanding oil analysts. 

Oil Production 

Global oil production by country and region, updated daily.


Evolution of all country and regional production using our cutting-edge nowcast technology.


Satellite based daily oilfield flaring monitoring powered by ESA. Intuitive user interface with interactive heatmaps to simplify the most complicated country and regional comparisons.

Flow Tracking

Daily updated oil flows between countries (or US PADDs or China Provinces), regions or organisations. Global oil flows coverage, across the barrel


Flexible filters to create fully customisable import/export flows, filtered by country, quality and grade.


Dynamic heat map and flow diagrams based on your filters. 

Refining 

Global refinery throughput, capacity and utilisation for all main oil trading areas, updated daily.


Future refinery capacity additions and turnarounds based on OilX proprietary satellite analytics.


Intuitive user interface that includes interactive heatmap for countries comparisons. 

Oil Demand 

Global oil demand by product, country and region, updated daily.


Evolution of all country and regional demand using our cutting edge nowcast technology.


Leveraging high-frequency demand indicators to nowcast end-use oil demand. Intuitive user interface with interactive heatmaps to simplify the most complicated country and regional comparisons. 

Oil Storage

Global oil stocks segmented by commercial and governmental stocks, by country.


Satellite based crude oil storage monitoring by terminal and crude quality powered by ESA and Aresys technology.


Daily crude oil floating storage measurements.

Data visualisation & connectivity

OilX timeseries data is available in EA's Data Explorer and via API.


The Data Explorer tool offers an intuitive experience to effortlessly find, visualise, and download data, or generate scripts to retrieve these datasets directly from our API or by using our Excel add-in.

Understand how OilX works

Dr Florian Thaler, Head of OilX, and Dr Nicky Ferguson, Head of Quantitative Research, discuss the power of OilX data and how it works on the EA Client Portal in a series of videos.

Explore comprehensive supply-demand balances and more, accessible via API , flat files and excel delivery. Watch the video to discover OilX's core features.

In this video learn how OilX's nowcasting provides daily predictions of global oil supply and demand. 

In this video explore the rigorous process of validating live data with ground truth data in OilX. 

Watch the video to learn how you can discover global oil trends instantly with the OilX dashboard, offering detailed insights from regions to individual fields. 

Watch this video to understand how you can access OilX's data through a web application and API, integrating it into your systems for advanced model creation. 

Watch the video to understand how the OilX team blends domain expertise with data science to effectively tackle complex problems, helping clients to merge traditional and data-driven methods.

Watch the video to understand how OilX can help you gain deeper insights into high-frequency data and its impact on trading and pricing decisions. 

Stay ahead with high-frequency data crucial for understanding market shifts. Watch the video to see why it's a must-have for traders.

Use OilX's metadata to enhance your models. Watch the video to see how you can create these bespoke solutions focused on particular components of oil markets including storage, production, trade and refining. 

Leverage OilX's data with your physical assets insights to create a proprietary model. Watch the video to learn more.

Understand the quantamental way of trading with OilX's comprehensive physical data. Watch the video to learn about this integrated approach.

Understand market drivers with high-frequency data from the EA Quant service. Watch the video to see how this pairing aids positioning in paper markets.

Watch the video to see how EA's Quant Analytics uses OilX data to explain market dynamics and deploy capital effectively. 

Our data partners

Share by: