Quant Analytics

Applying scientific principles to market-orientated thinking

Download Brochure →

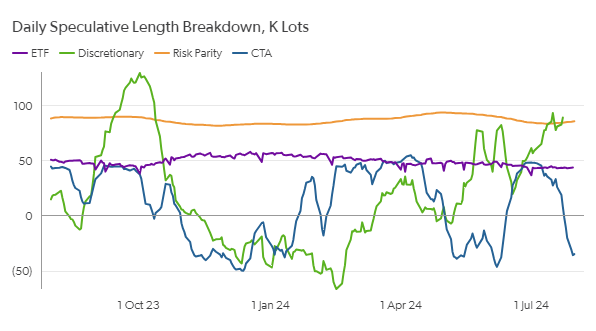
EA Quant models and tracks derivative flows across futures, options, and swaps markets. Our proprietary analytics offer daily comprehensive updates on positioning, risk, and trading activity of major financial traders, including CTAs, discretionary hedge funds, risk parity funds, and ETFs.

Gain an edge with our quant insights

Stay ahead of the curve by accurately anticipating market positioning and flows across markets.

Daily position updates

Daily positioning updates for Systematic funds, Discretionary Funds, Risk Parity Funds, and Exchange Trading Funds (ETFs).

Unrivalled visibility into systematic trading flows

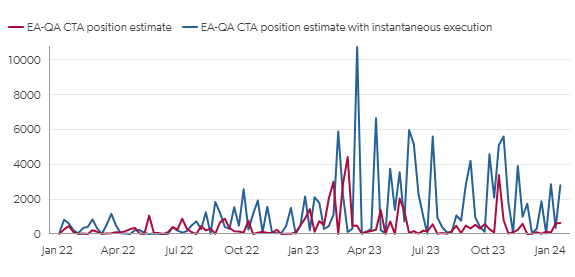
Predict the market impact of flows from systematic funds, factoring in both size and key trading levels.

Options dynamics

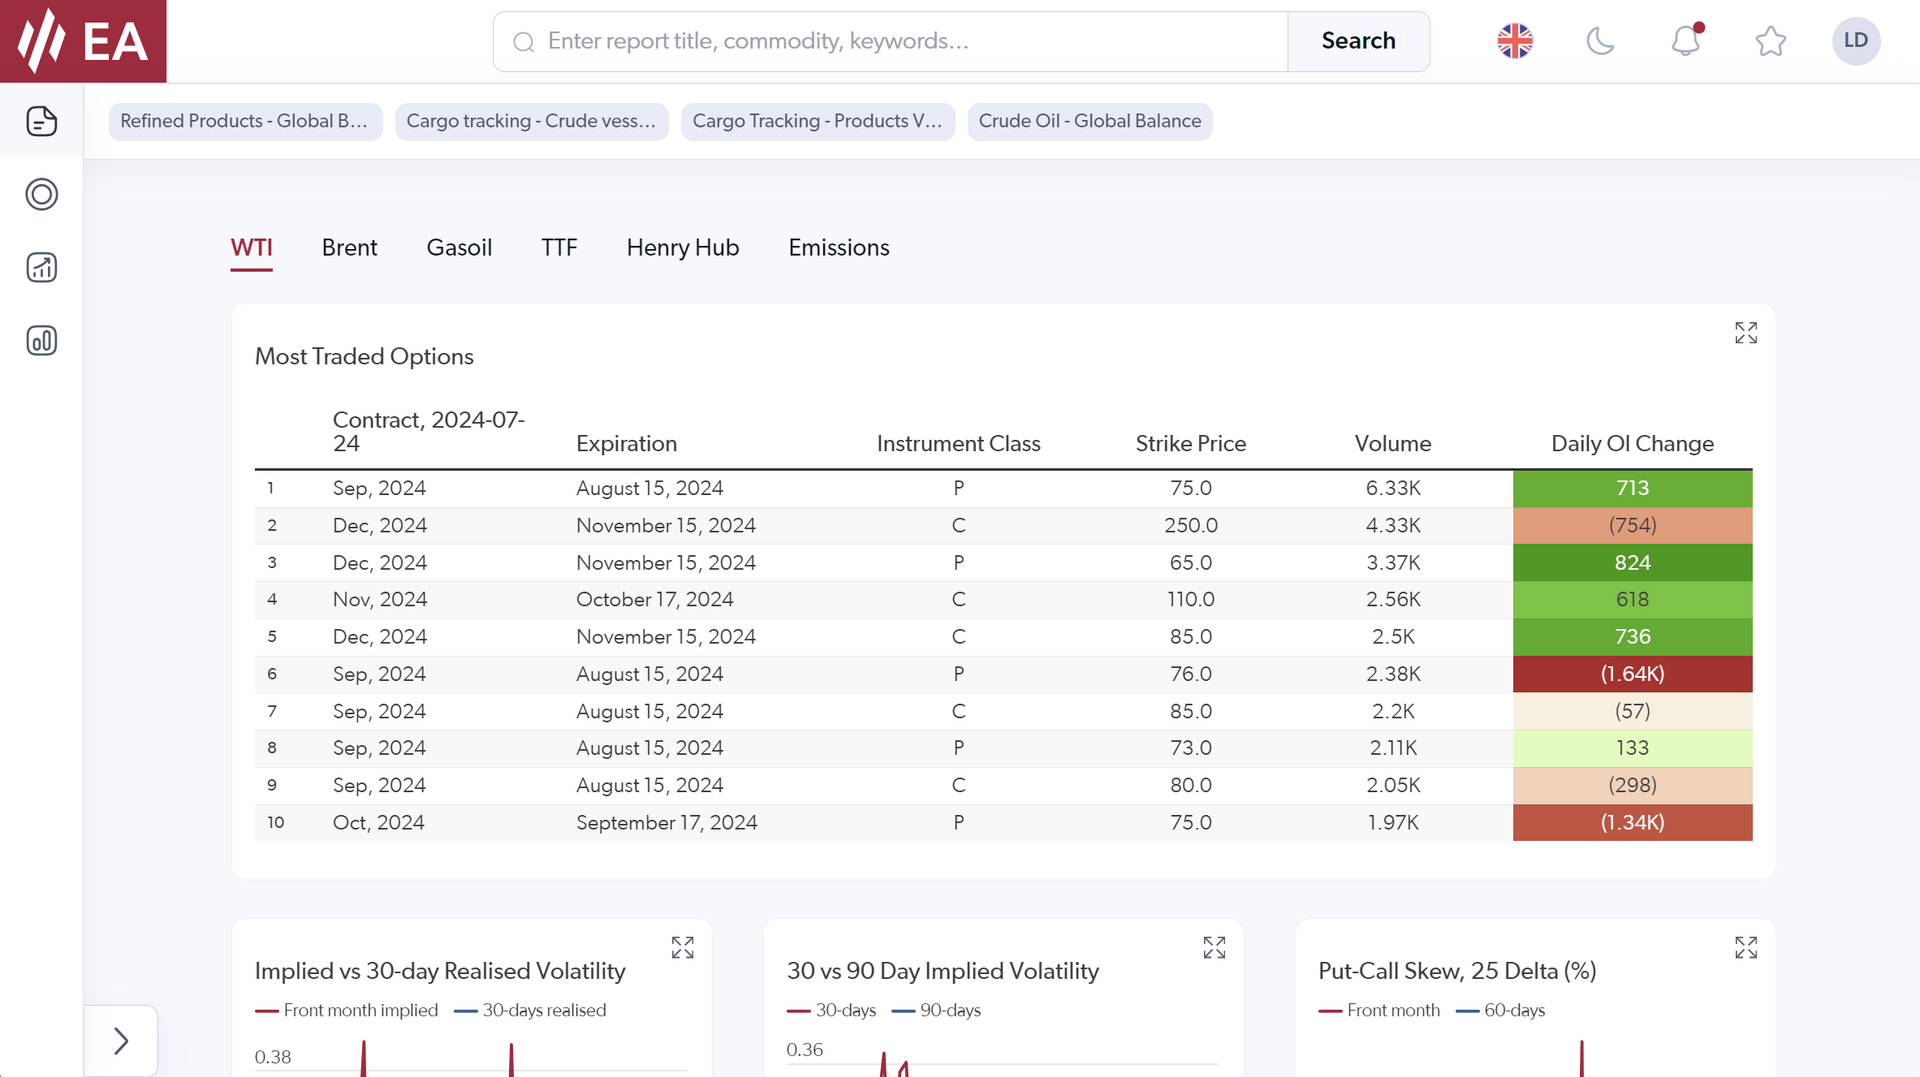
Estimate the magnitude of delta hedging by options dealers and foresee price pinning as expiration approaches.

Avoid the crowds

Identify when the market positioning is at extreme levels and when price reversals are likely to occur.

Understand what’s driving markets

Proprietary quantitative models detect and highlight changes in key fundamental, financial, and macro price drivers.

EA Live

Stay informed with intraday insights and analysis directly from the Quant desk, accessible via desktop and mobile app.

Understand the complete picture

Analysing financial flows has become increasingly important in recent years due to the influx of discretionary capital. Physical fundamentals alone no longer explain price movements in markets. Our expert quantitative analytics help you gain a comprehensive understanding of the market through:

Cutting-Edge data-driven research

  • Access to in-depth quantitative research designed to help you determine the most relevant price drivers in markets.
  • Our systematic framework provides actionable insights, empowering you to make decisions with robust, timely data. 

Modelling all major market participants

  • We distinguish ourselves from other providers by modelling and isolating ALL major participants, not just CTAs. 
  • Additionally, we track the positioning of participants in addition to their flows, offering a complete and comprehensive view of the market.

Blending models and human expertise

  • The Quant Analytics service merges quantitative rigour with years of experience in commodity derivatives trading.
  • Through methodical analysis of quantitative data, we isolate and tag significant trade flows to either speculative or commercial traders, offering critical insights into market risk dynamics.

Equip yourself with timely information that drives critical decision-making.

Your Quant Analytics subscription includes

(We continue to develop and expand the offering).

EA Live Quant feed:

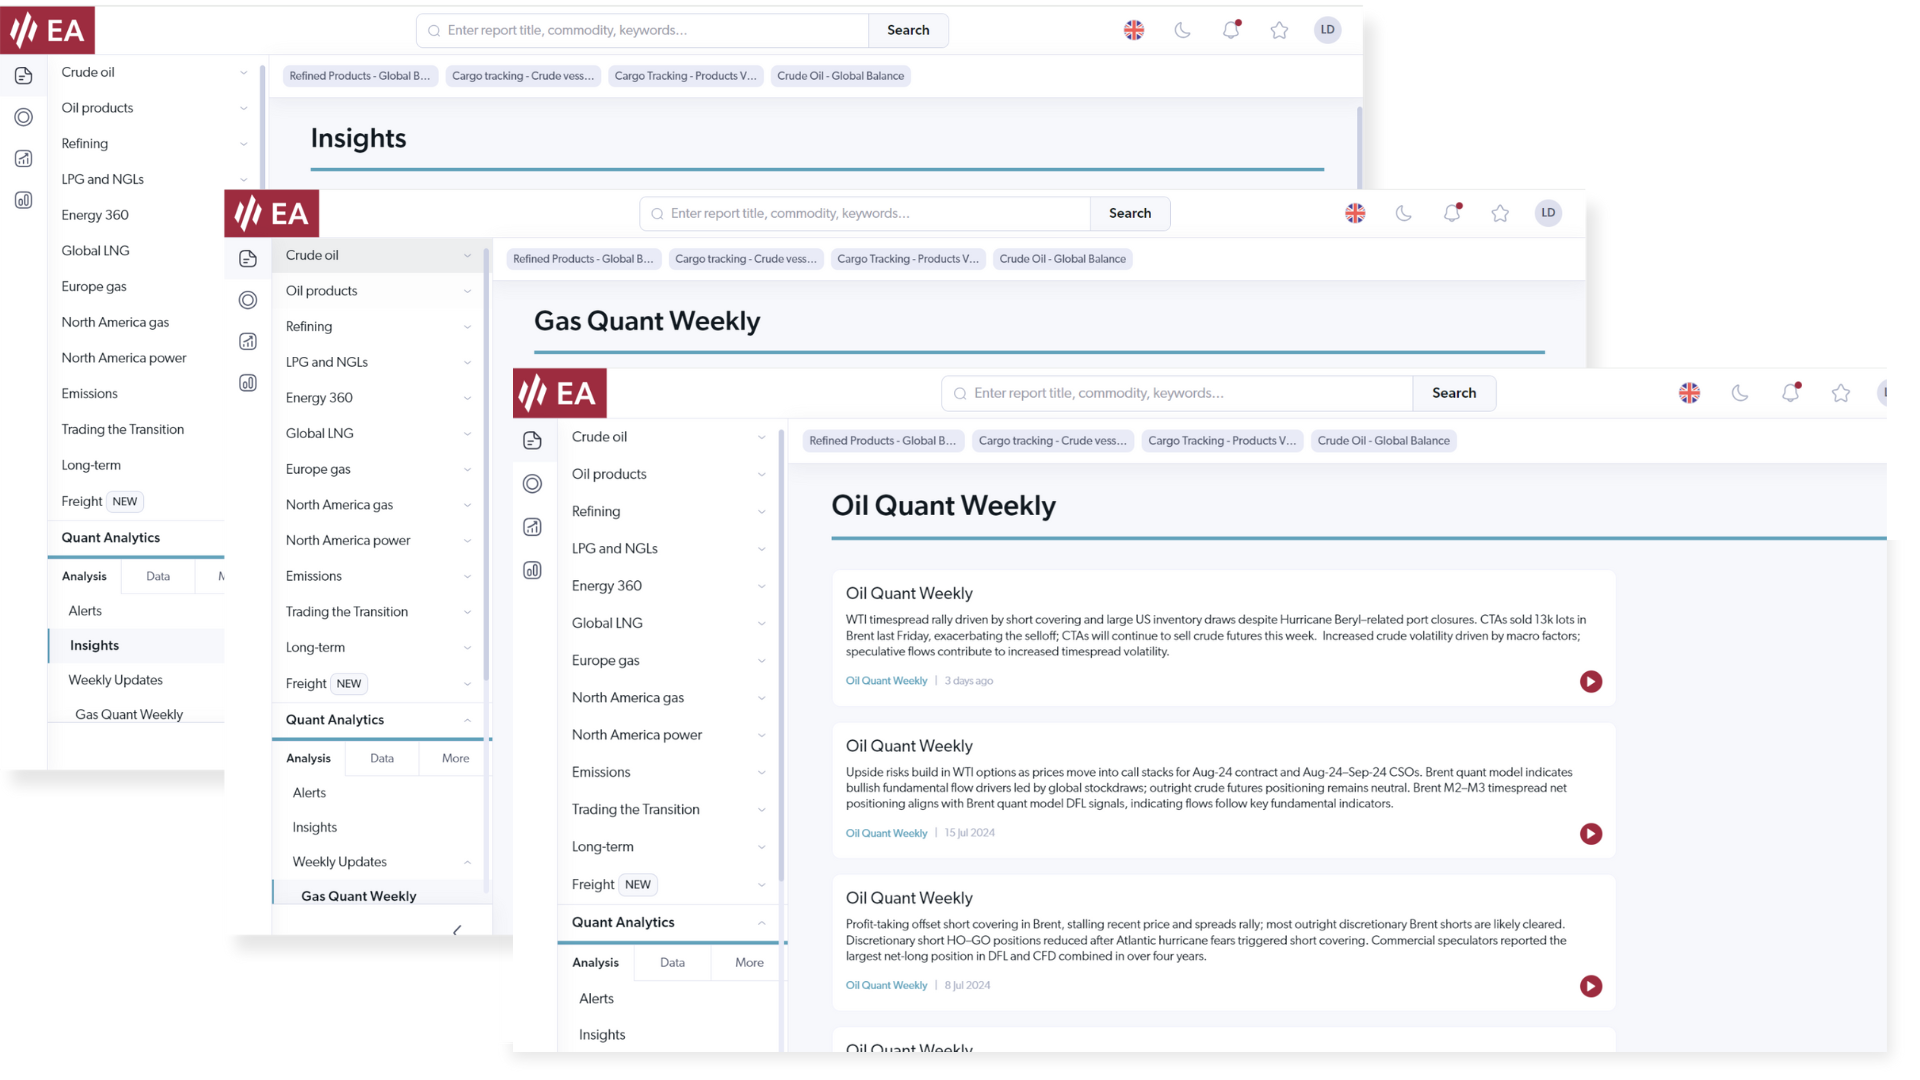
Receive commentary throughout the day via desktop or mobile app, providing immediate insights on significant market movements directly from our quant analysts.

Daily paper balances:

Access systematically calculated metrics and charts that are updated daily, featuring predicted trade flows, positions of major participants such as CTAs and discretionary hedge funds, open interest changes, and market crowdedness.

Daily Options dashboard:

Get comprehensive daily analysis of listed options, monitoring flows, risk exposure, dealer’s gamma, and other key metrics.

Short and long-form research:

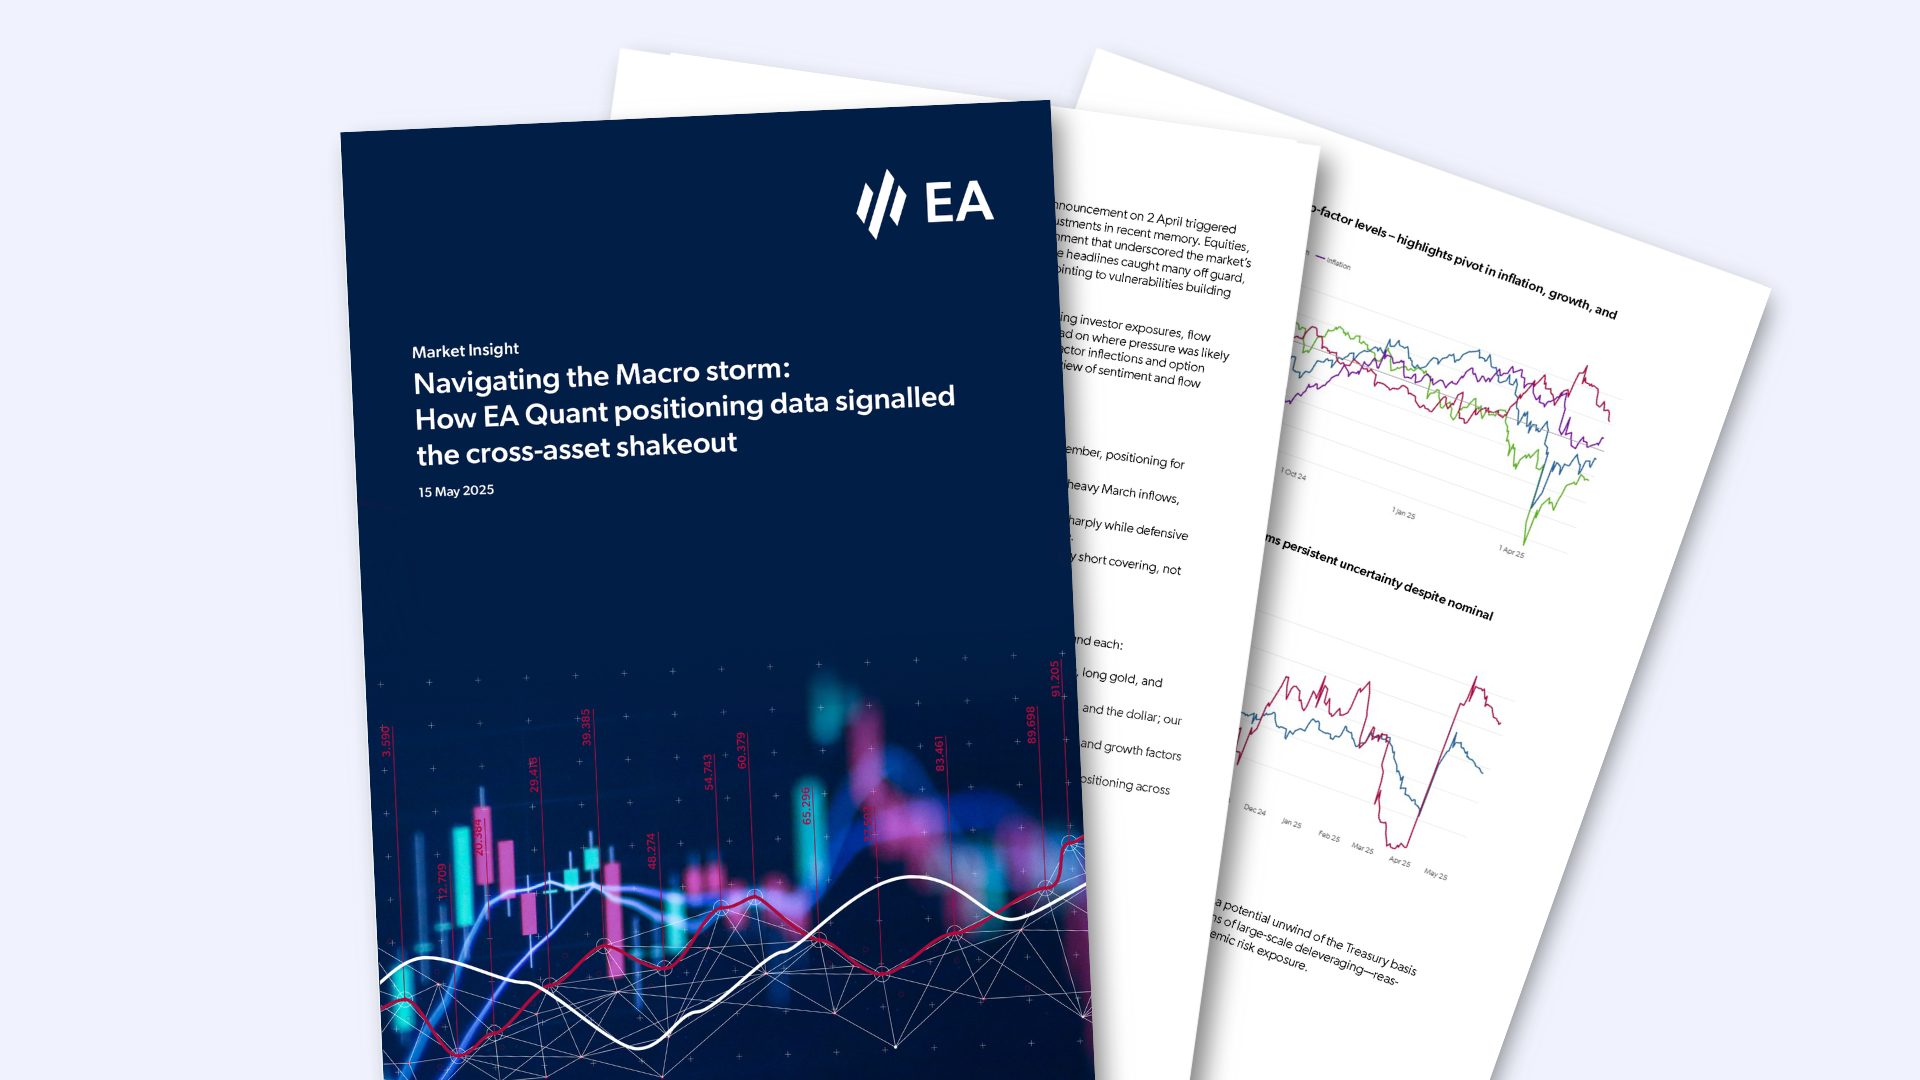
Stay informed with both short and long-form research. Quant Weekly contextualises market flows and highlights crucial price drivers, while our long-form Quant Insights delve deep into market structure, ensuring you have a comprehensive understanding of markets.

Transparency and replicability:

Our Quant Insights openly detail statistical methods, assumptions and data used, empowering you to replicate the analysis yourselves and build your own models. This transparency gives you confidence in our methodologies, ensuring you have accurate information for your decision-making.

Historical data API and Data Explorer:

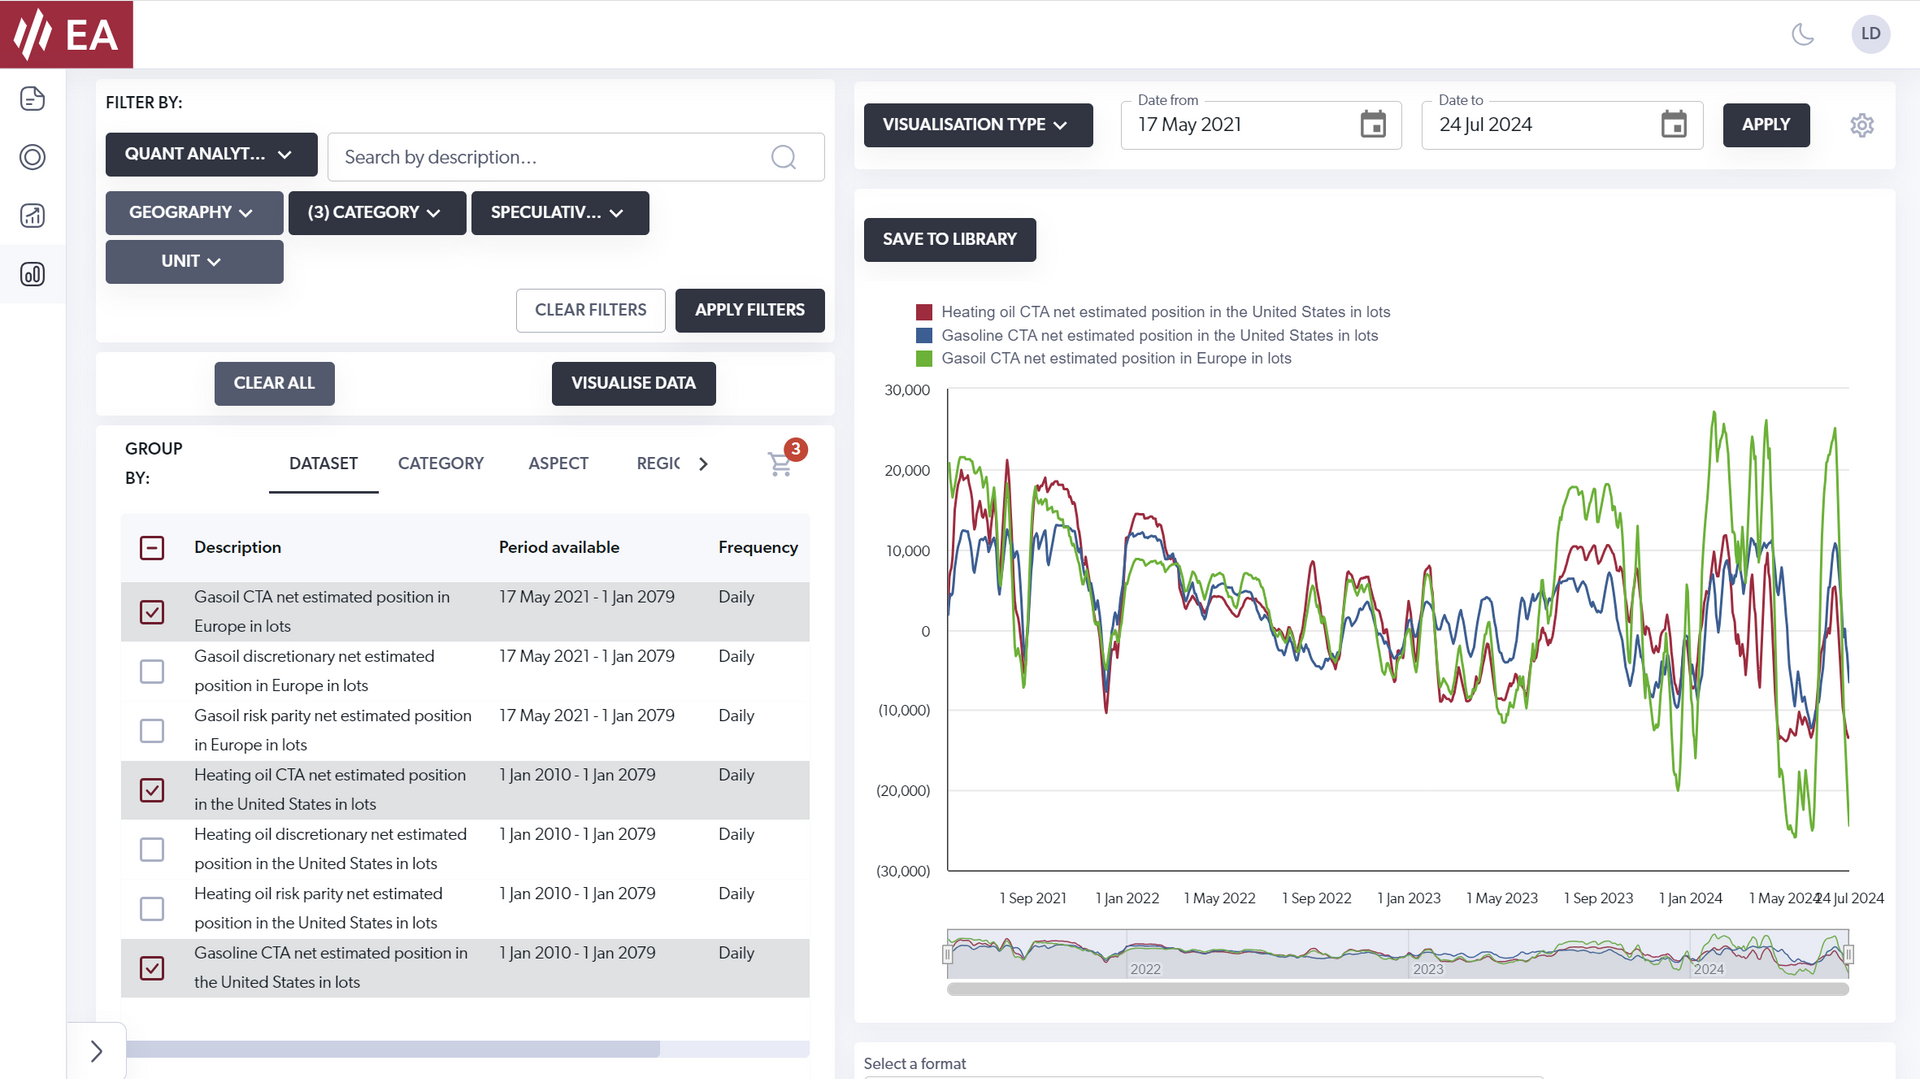
Access daily and historical data in Python JSON or CSV/XLSX formats for back-testing and analysis. Our Data Explorer app enables quick and intuitive visualisation of historical quant data with no coding required, allowing you to easily chart, save to your library, and generate images to share with colleagues.

Share by: