


Our team discussed the latest developments shaping global crude storage, including major coverage additions, evolving inventory patterns.
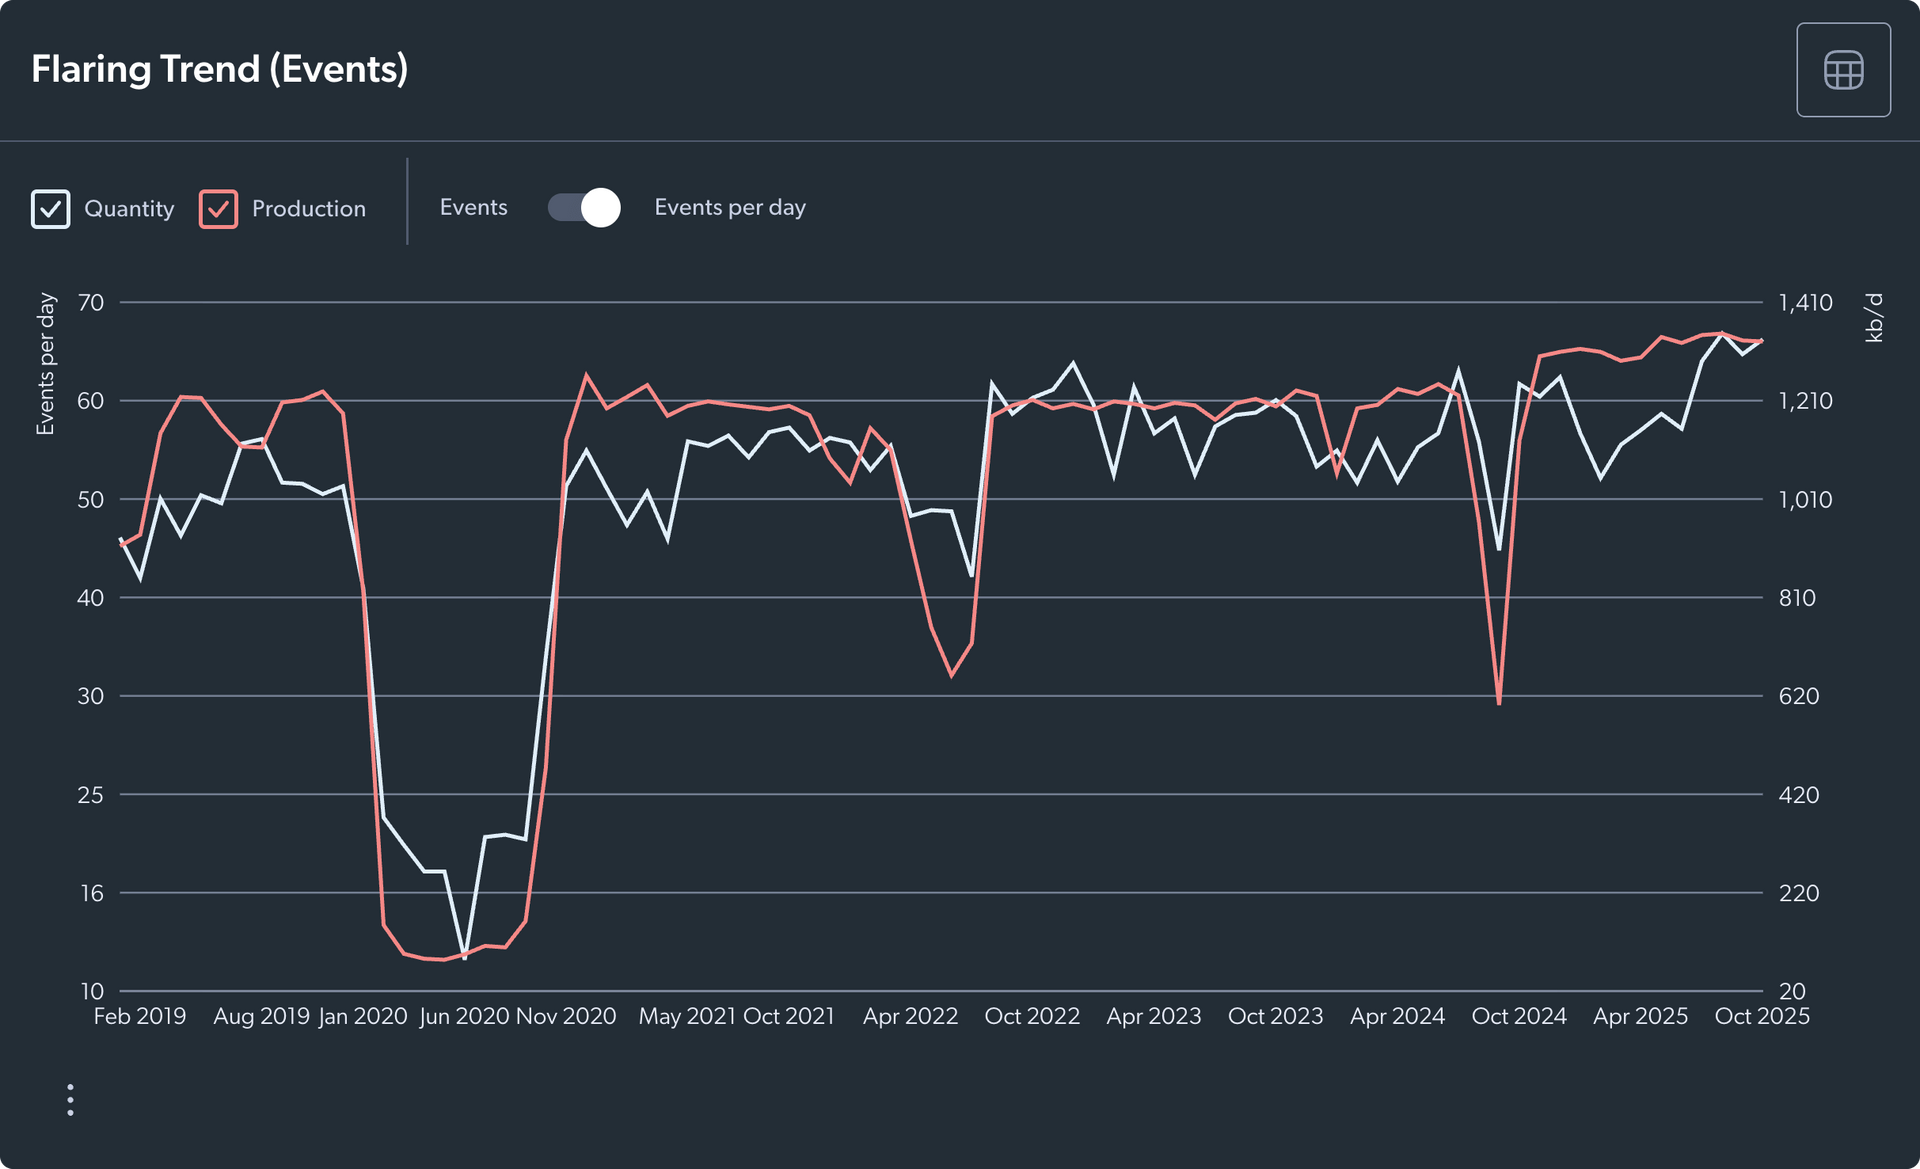
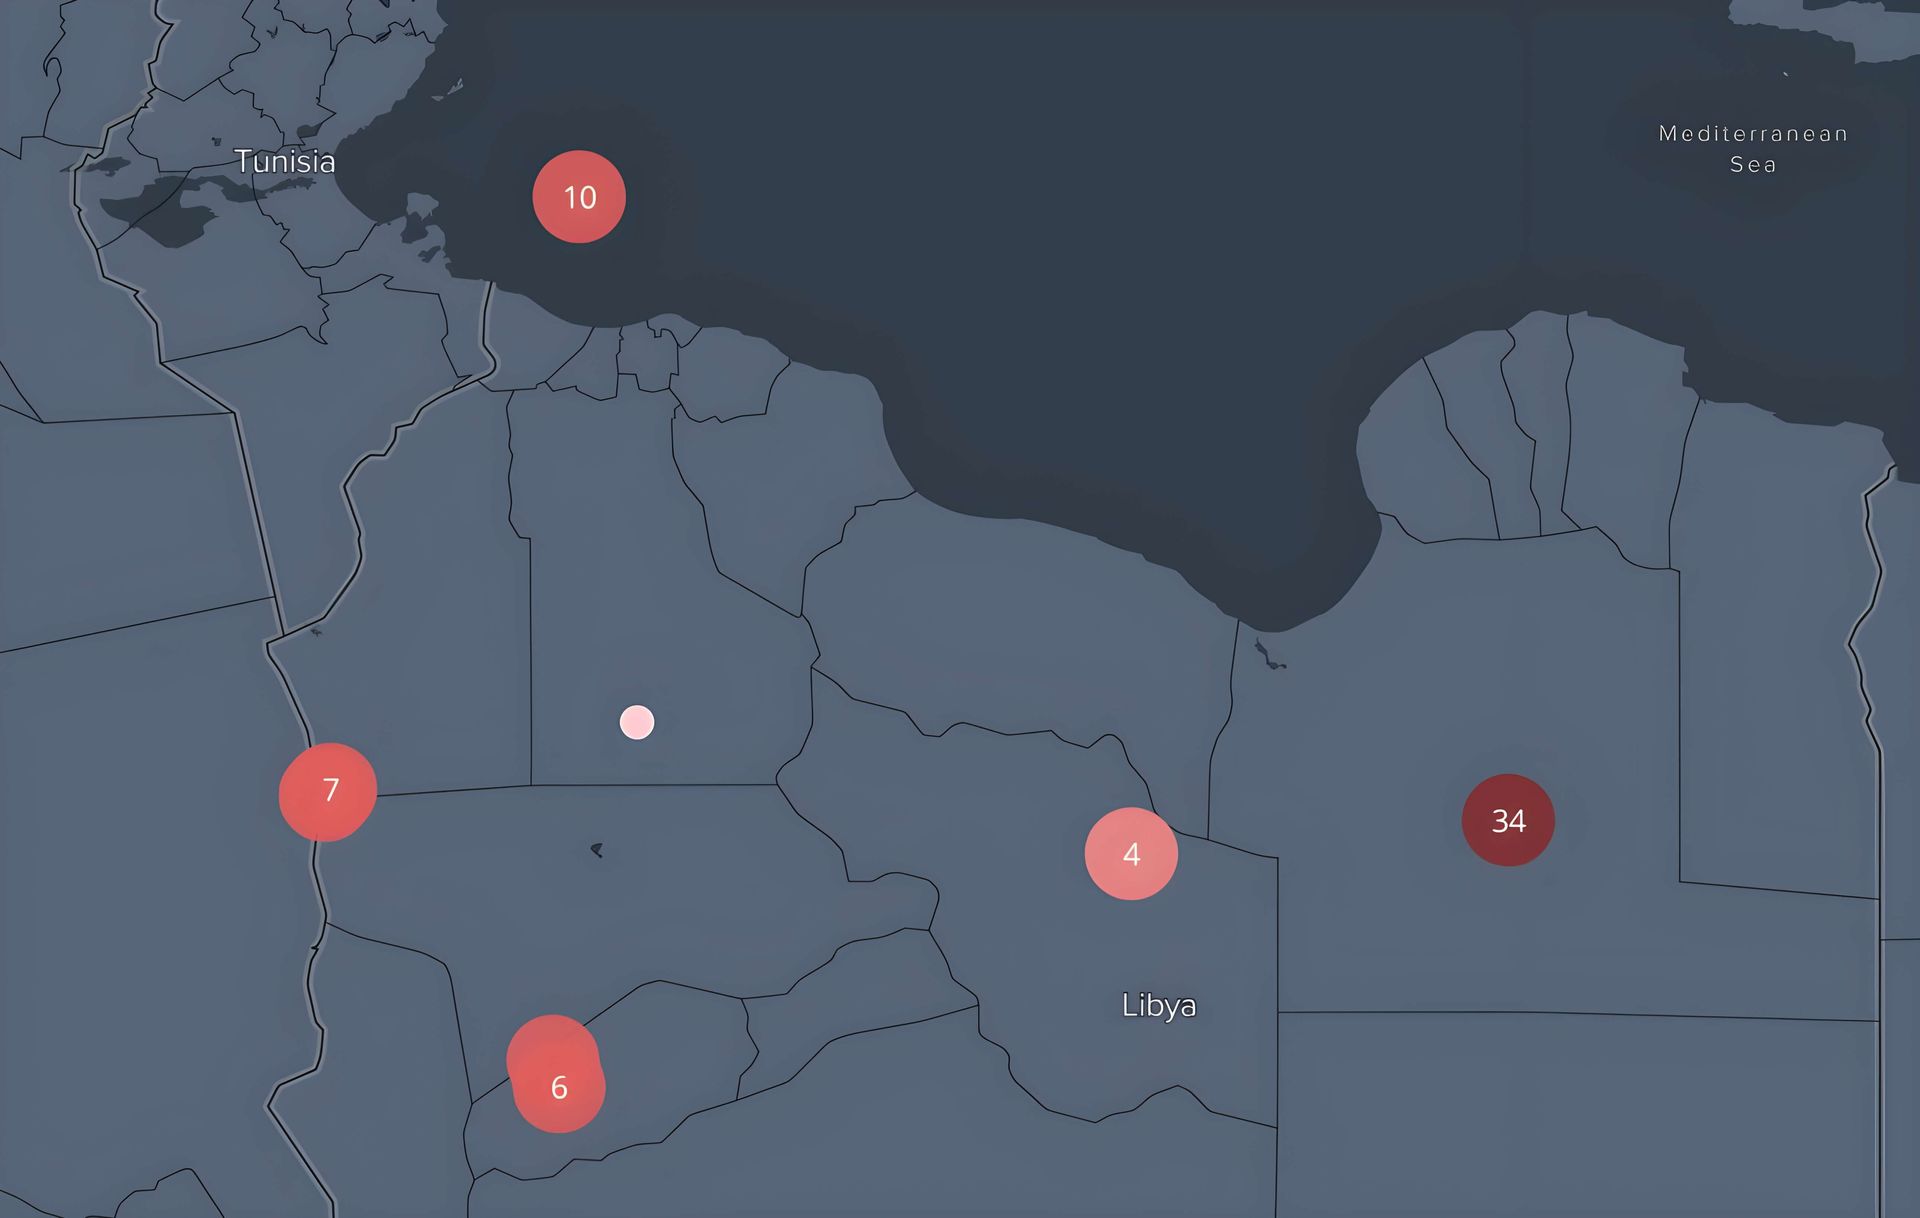
The market is treating Hormuz as binary: open or closed. EA's proprietary maritime data shows oil flow recovery will be slow, uneven and may never fully normalise.

High-frequency data suggest higher oil prices have yet to trigger meaningful demand destruction, with trucking, gasoline and jet fuel consumption largely resilient.