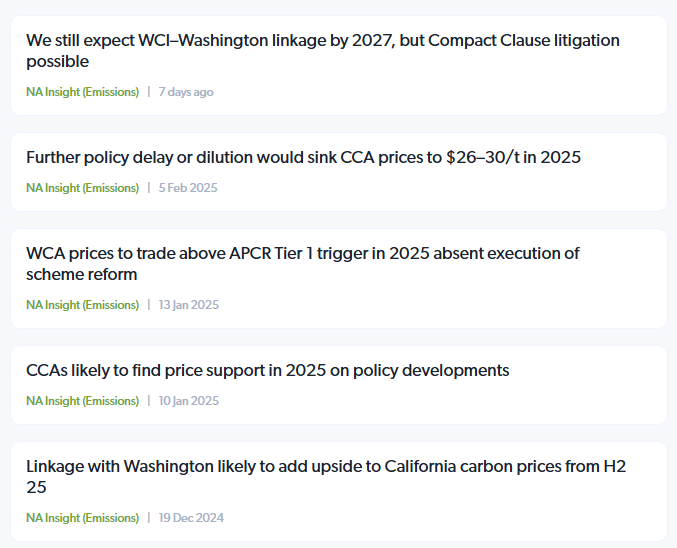
North America Carbon Emissions trading
Market-leading insight and analysis on US carbon trading markets
Energy Aspects' North America Carbon Emissions service meticulously tracks supply, demand, and price trends, along with their interaction with policy updates for carbon trading schemes across the continent (including both the USA and Canada).
Gain deeper knowledge of the North American carbon emissions trading landscape
Unlock comprehensive insights into the US and Canadian emissions markets, with expert analysis on regulatory developments and market trends.
The North America Carbon Emissions service provides comprehensive insights and analysis tailored to the unique dynamics of the emissions markets across the United States and Canada.
You gain access to in-depth reports on regulatory developments, market trends, and price forecasts, enabling you to navigate the complexities of regional emissions trading systems effectively.

North American emissions insights
Explore in-depth coverage of key cap-and-trade schemes, including RGGI and WCI, to understand the dynamics of North American carbon emissions.
Coverage of key locations
We offer in-depth coverage of the US Northeast’s Regional Greenhouse Gas Initiative (RGGI) and the Western Climate Initiative (WCI) in California and Quebec, as well as the development of emerging emissions markets in China and beyond.
Our North America Emissions service focuses on the WCI (California, Quebec and Washington) and RGGI (US Northeast) cap-and-trade schemes, with particular emphasis on short- and medium-term pricing, policy impacts, and projected emissions and allowance supply.


Integrated energy market overview
Drawing from our extensive experience in the North American oil, gas, and power markets, as well as our expertise in European carbon markets, our service presents an integrated overview of the future direction of US and Canadian cap-and-trade programmes. This includes insights into America's CO2/Carbon emissions and Canada's CO2/Carbon emissions, helping you understand the broader context of carbon emissions in North America.
Your North America Carbon Emissions trading subscription
Find out what your subscription includes.
Short and long-form research:
Stay informed with both short and long-form research. Monthly North America and Offsets Outlooks provide a detailed analysis and forecast of market trends, regulatory impacts, and price movements in the emissions markets across the United States and Canada, offering strategic insights for the upcoming month. You will also receive North America and Offsets Insights delivering timely updates equipping you with the knowledge to make informed decisions.
North American Emissions data:
Visualise complex data with our dashboards for US emissions and offsets. Also, leverage our daily and historical data in Python JSON or CSV/XLSX formats for back-testing and analysis.
Data Explorer:
Our
data visualisation tool enables quick and intuitive visualisation of historical emissions data with no coding required, allowing you to easily chart, save to your library, and generate images to share with colleagues.


